Chart Fields
Charts are another special field. A big difference between charts and other fields is that unlike other fields which only hold a single value, charts hold multiple values. In most cases, charts display a value as a column at the height of the value for a sequence of categories. Other series of values (for the same categories) can be displayed in a different color. So charts hold a matrix of values by categories and series.
There are several exceptions:
|
|
|---|---|
|
|
|
|
Chart Fields Exercise
Open a new blank document and insert a column chart.
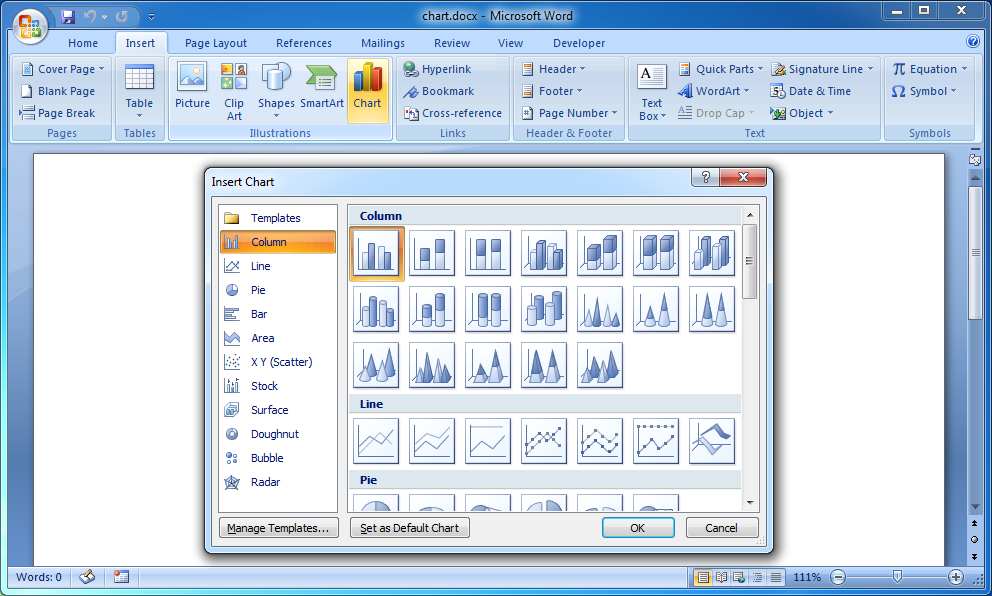
Open a new blank document. Select Chart in the Insert ribbon to open the Insert Chart dialog box and select Clustered Column Chart from the Insert Chart dialog box (see picture below).

Change the categories data type and format.
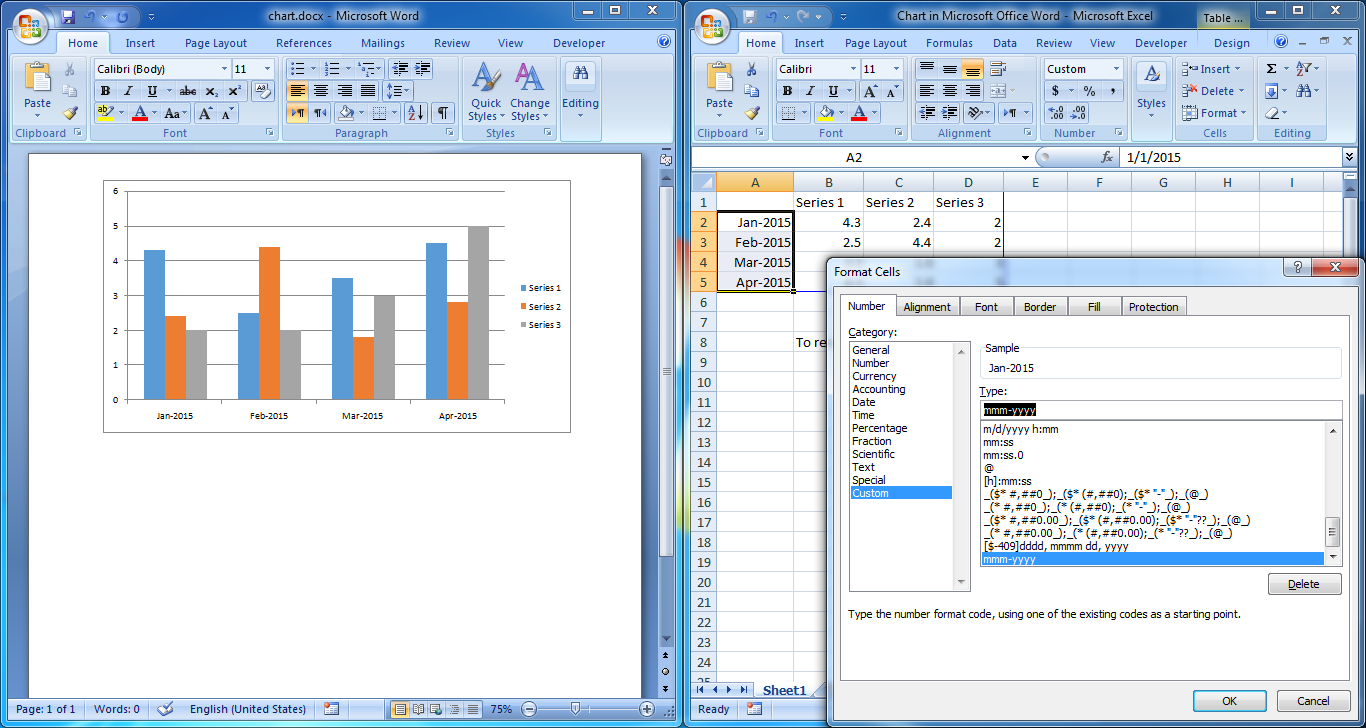
After you insert a chart the values matrix by categories and series is opened and can be edited in Excel. Insert date values for the categories and set the format to month and year (see picture below).

Just like all other fields, you set the data types and formats in the template and insert the values when creating a new document so all the values and number of series, categories and values will be removed and replaced with the values you insert but the data types and formats will remain.
The series are the names of series of values by categories so they can only be text values. The sequence of categories can be date, number or text values. The values are represented by column heights so they can only be number values. Except for X, Y, Size charts which hold a list of X, Y, Size number values.
Enter the chart field name.
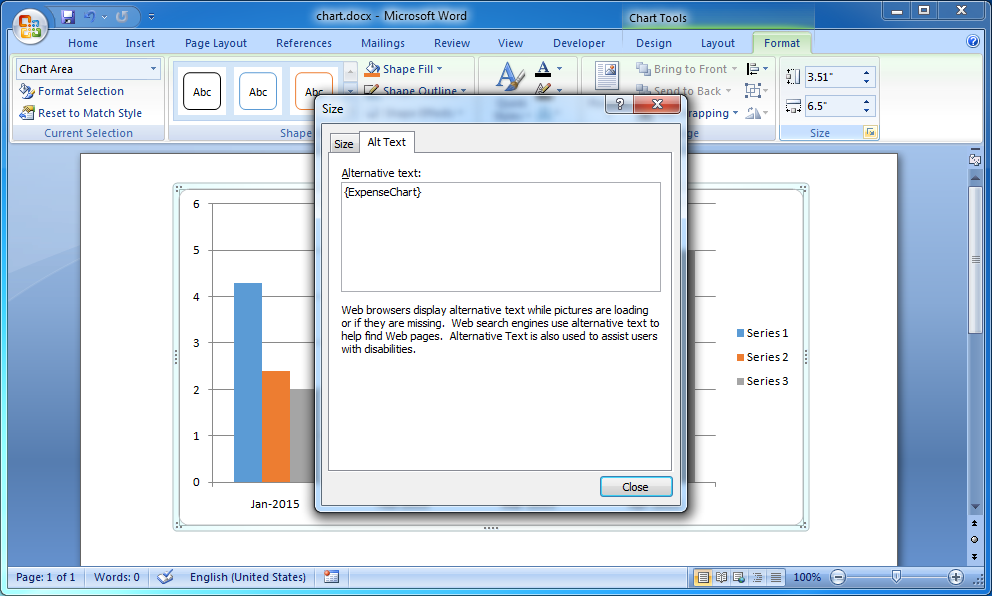
Select the chart. Click the corner of the Size group in the Format ribbon to open the Size dialog box. Select the Alt Text tab in the Size dialog box and enter "{ExpenseChart}" in the Alternative Text box (see picture below).

Compile the template.
Create the .DOCX file.
Copy and save the data below to "/tmp/chart.xml".
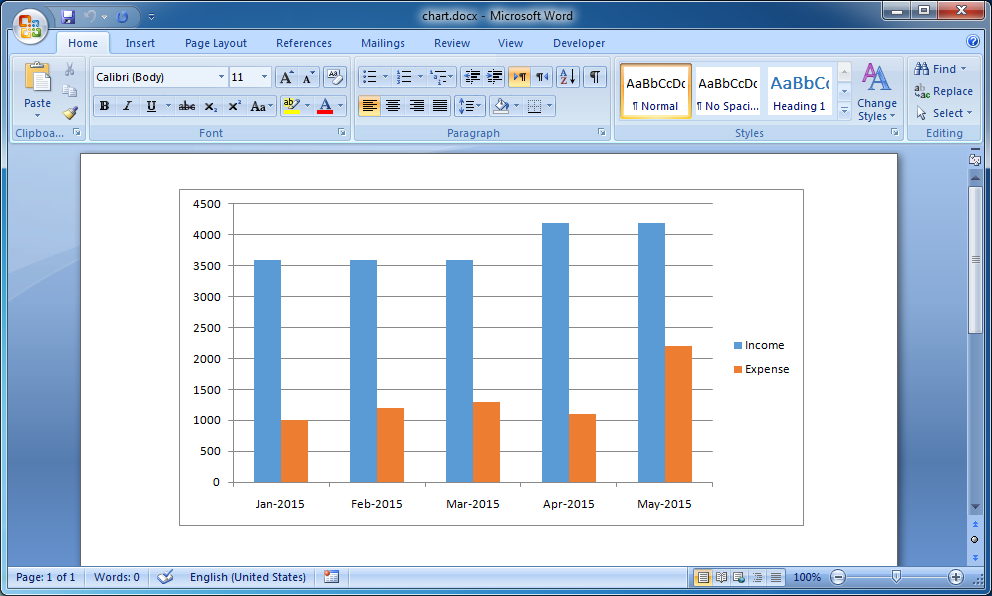
<ExpenseChart> <Point> <Series>Income</Series> <Category>2015-01-01</Category> <Value>3600.0</Value> </Point> <Point> <Series>Income</Series> <Category>2015-02-01</Category> <Value>3600.0</Value> </Point> <Point> <Series>Income</Series> <Category>2015-03-01</Category> <Value>3600.0</Value> </Point> <Point> <Series>Income</Series> <Category>2015-04-01</Category> <Value>4200.0</Value> </Point> <Point> <Series>Income</Series> <Category>2015-05-01</Category> <Value>4200.0</Value> </Point> <Point> <Series>Expense</Series> <Category>2015-01-01</Category> <Value>1000.0</Value> </Point> <Point> <Series>Expense</Series> <Category>2015-02-01</Category> <Value>1200.0</Value> </Point> <Point> <Series>Expense</Series> <Category>2015-03-01</Category> <Value>1300.0</Value> </Point> <Point> <Series>Expense</Series> <Category>2015-04-01</Category> <Value>1100.0</Value> </Point> <Point> <Series>Expense</Series> <Category>2015-05-01</Category> <Value>2200.0</Value> </Point> </ExpenseChart> |
Enter the commands below in the command line.
$ word-processing-merger \ "/opt/DocxFactory/exercises/templates/chart.dfw" \ "/tmp/chart.xml" \ "/tmp/chart.docx" |
Note: That no items were created in the template and no items were pasted in the code. DocxFactory supports templates that have only fields for such cases as simple letters.
There are several exceptions to setting chart fields:
|
|
|---|---|
|
|
|
|
Notes:
The sort order of the chart series and categories in the created document is the order you add them to the values matrix.
The series and categories (if the categories values are text) are not case sensitive. For example: the series "Income" and "income" refer to the same series but the chart series and categories in the created document use the series and categories casing when they were first added with the exception of single series charts and fixed series charts that keep the series casing in the template.
Every time you add a new column or row to the values matrix by adding a new series or category the new values are initialized with a value of zero. For example: if you add a new series and not set one of the values for a category for that series then its value will be zero.
An empty chart with no values cannot be shown so if no values are set for a chart field then the chart will not be in the created document.
If a value for the same category and series is set more than once then the value is accumulated so you can set a chart field from a detailed list that will be summarized by categories and series.
Open the created .DOCX file (see picture below).
